Guide
How to Track Team Velocity in Trello
What velocity actually tells you, how to measure it, and how to use it to plan sprints your team can actually finish.
What velocity is (and what it isn't)
Velocity is the number of story points your team completes in a sprint. That's it. You finish a sprint, count the points in Done, and that number is your velocity for that sprint.
It sounds almost too simple to be useful, but here's the thing - after 3 or 4 sprints, you have a pattern. You know that your team typically finishes somewhere between 25 and 35 points per sprint. That range is worth more than any amount of gut-feel estimation.
What velocity is not: a performance metric. This is the most common mistake teams make with it. The moment velocity becomes a target - "we need to hit 40 points this sprint" - people start gaming it. Cards get split into tiny pieces, estimates get inflated, and the number goes up while actual output stays the same. Velocity is a planning tool, not a scoreboard.
How to measure it
The rules are straightforward:
- Only count Done cards. If a card is 90% finished but still in progress at the end of the sprint, its points don't count. This sounds harsh, but it keeps the measurement honest. Partial credit creates fuzzy data.
- Use the final estimate. If a card was estimated at 3 points but re-estimated to 5 mid-sprint, use 5. The final estimate reflects what the work actually was.
- Keep sprint length consistent. Velocity only makes sense when you're comparing equal time periods. Switching between 1-week and 2-week sprints makes the numbers meaningless.
- Don't count carried-over work twice. If a card rolls into the next sprint and gets finished there, it counts for that sprint - not the one where it was started.
Reading the velocity chart
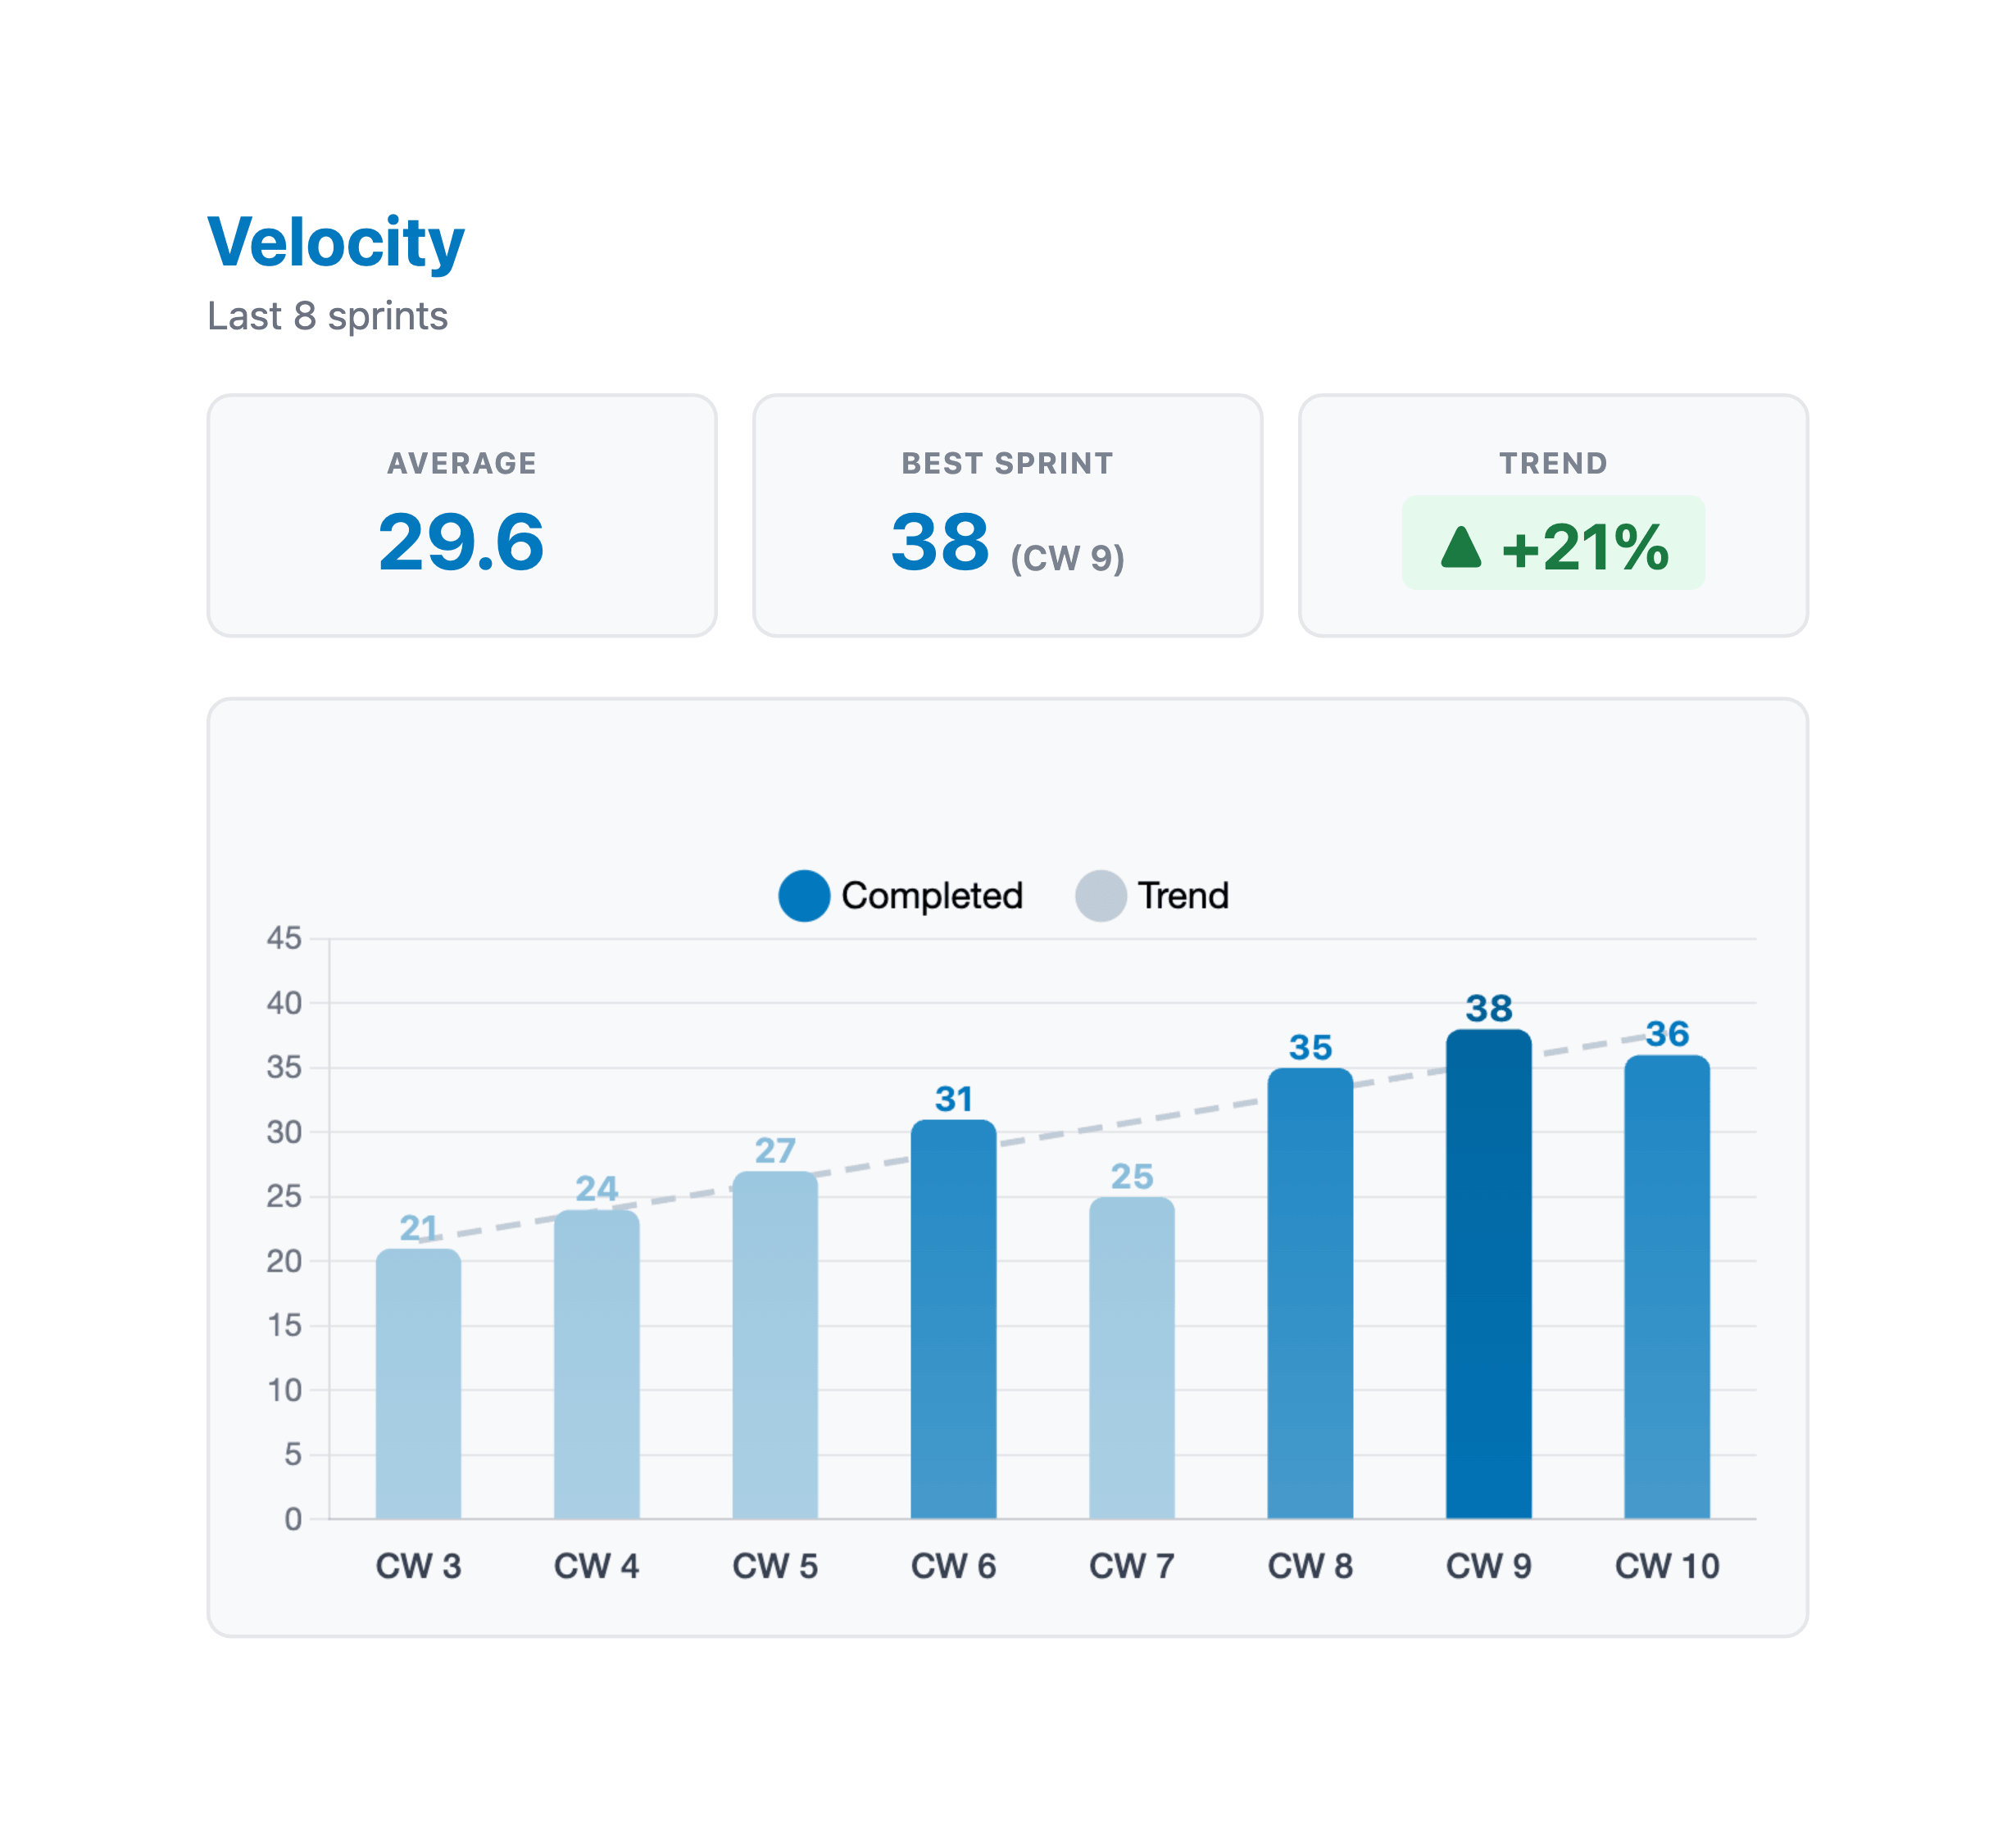
A velocity chart is a bar chart with one bar per sprint. Each bar shows the completed points for that sprint. Most velocity charts also include an average line - a horizontal line showing the mean across all tracked sprints.
The average line is your planning anchor. When someone asks "how much can we take on next sprint?" the honest answer is "probably around our average." Not the best sprint you ever had. Not what you hope for. The average.
The spread of the bars matters too. If your bars are all between 28 and 34, your velocity is stable and predictable. If they bounce between 15 and 50, something is off - maybe sprint scope changes a lot, maybe team availability varies wildly, maybe the estimates themselves are inconsistent.
Common velocity patterns
The ramp-up. New teams or teams adopting scrum for the first time usually see velocity climb over the first 3-5 sprints. This isn't because people are working harder - it's because they're getting better at estimating, breaking work down, and finishing things within a sprint. This is normal and healthy. Don't try to extrapolate from the first sprint or two.
The plateau. After the ramp-up, most teams settle into a range. Sprint-to-sprint variation of 15-20% is normal. If your average is 30, finishing anywhere between 25 and 35 is fine. This is the steady state you want - predictable enough to plan with, flexible enough to absorb surprises.
The spike. One sprint that's way above average. Maybe a lot of small cards landed at once, or a large piece of work that had been in progress for weeks finally shipped. Spikes are fine as one-offs - just don't use them as the new baseline for planning. Your next sprint probably won't repeat it.
The dip. One sprint that's way below average. Holidays, sick days, a production incident that ate the week, or a hard technical problem that took longer than expected. Dips happen. If they're occasional, they're not a problem - the average absorbs them. If velocity is declining over several sprints, that's a different conversation.
The decline. Velocity dropping over 3+ sprints usually means something structural changed. Team members left, technical debt is slowing things down, or the remaining backlog items are genuinely harder than what came before. This is a signal worth investigating in your retrospective.
Using velocity for sprint planning
This is where velocity earns its keep. During sprint planning, instead of guessing how much work the team can handle, you look at the velocity chart and commit to roughly the average.
"Roughly" is the key word. Velocity isn't a contract. If your average is 32, pulling in 30-34 points is reasonable. Pulling in 50 because "we really need to ship this" is setting the team up to fail.
A few practical tips:
- Use the last 3-5 sprints. The average across your entire history weights early sprints (when the team was still ramping up) the same as recent ones. A rolling average of the last few sprints is a better predictor.
- Account for known disruptions. If someone is on vacation for half the sprint, or there's a company all-hands on Wednesday, plan for slightly below average.
- Build in a buffer. If your average is 30, committing to 27 gives the team room to breathe. Finishing early is always better than scrambling at the end.
Velocity anti-patterns
Comparing teams. "Team A does 40 points and Team B only does 25 - what's wrong with Team B?" Nothing, probably. Story points are relative to the team that created them. Team A's 5-pointer and Team B's 5-pointer are not the same amount of work. Velocity is for a team to compare against its own history, not against other teams.
Treating velocity as a KPI. The moment you tie velocity to performance reviews or team evaluations, the number becomes worthless. People will estimate higher, split cards unnecessarily, and rush to move things to Done even when they're not really done. You'll get bigger numbers and worse outcomes.
Reacting to single sprints. One bad sprint doesn't mean the team is struggling. One great sprint doesn't mean you've leveled up. Look at trends across 3-4 sprints before drawing conclusions.
Ignoring it completely. Some teams track velocity and then never look at it during planning. They just pull in whatever feels right. That defeats the purpose. If you're going to measure it, use it.
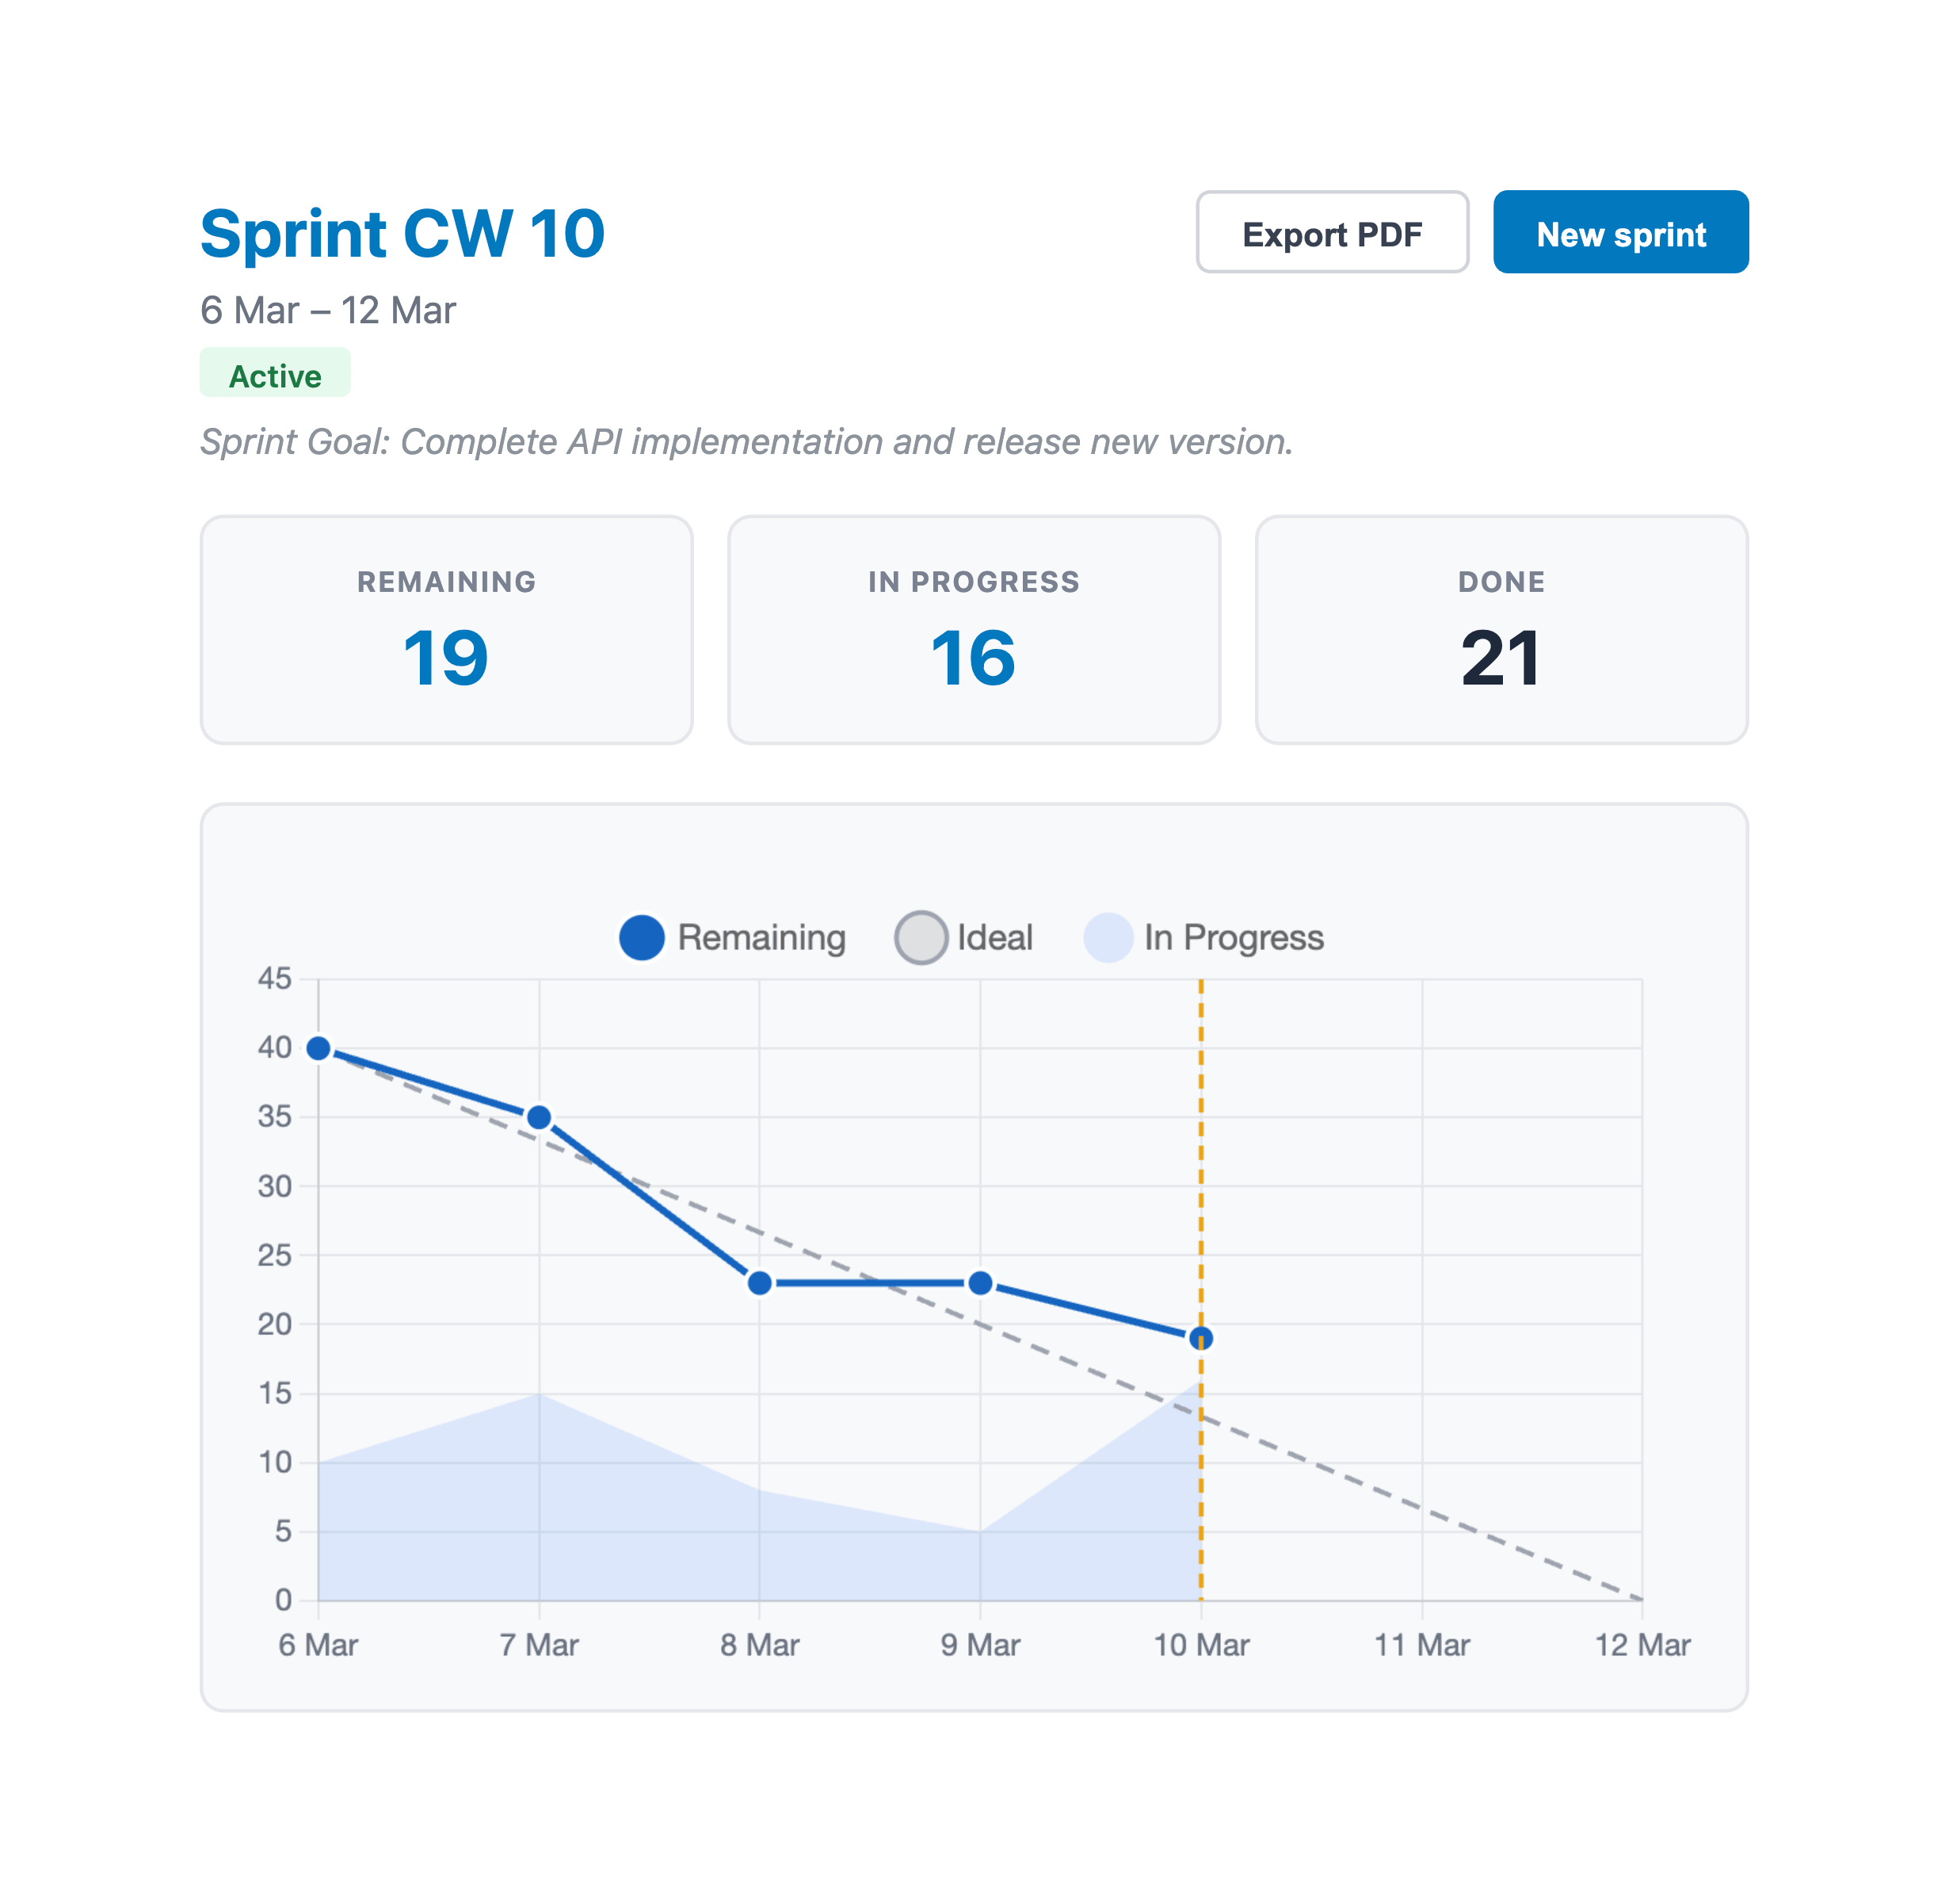
Velocity and burndown - the full picture
Velocity tells you how much work the team can do per sprint. Burndown charts tell you how the current sprint is going day by day. Together, they give you both the macro view (are we planning the right amount?) and the micro view (are we on track this sprint?).
If your burndown charts consistently show the team finishing everything by day 8 of a 10-day sprint, your velocity data is telling you that you could commit to more. If the burndown regularly shows a scramble at the end, you're over-committing - plan closer to (or slightly below) your average velocity next time.
Setting up velocity tracking in Trello
Trello doesn't have built-in velocity tracking. You need a Power-Up that remembers how many points were completed each sprint and plots the trend over time.
With EstiMate, velocity tracking happens automatically. When you close a sprint and start a new one, the completed points from the previous sprint get recorded. Over time, this builds up your velocity chart - bars for each sprint, plus an average line you can use for planning.
No spreadsheets, no manual tracking. Just finish your sprints and the data is there when you need it.
Keep reading
- How to Forecast When Your Project Will Be Done in Trello - point your velocity forward to a finish-date range
- Trello Sprint Planning Guide - use your velocity data to plan better sprints
- Burndown Charts for Trello - track day-by-day progress within each sprint
- How to Estimate Story Points in Trello - the estimation step that feeds your velocity
- Planning Poker in Trello - get better estimates with team voting sessions
- How to Set Up Trello for Scrum - board structure, ceremonies, and common pitfalls
- Capacity Planning for Trello Teams - plan sprint capacity based on team availability
- What 1,000 Trello Teams Taught Me About Estimation - patterns I keep noticing across teams
Track your team's velocity across sprints
EstiMate adds velocity tracking, burndown charts, and sprint planning to your Trello board. Free to get started.
Add EstiMate to Trello