Guide
Burndown Charts for Trello
How to track sprint progress with a burndown chart - what the lines mean, how to read the patterns, and what to do when things go off track.
Why you need a burndown chart
Halfway through a sprint, someone asks: "Are we on track?" Without a burndown chart, the answer is always a guess. You look at the Done column, count some cards, squint, and say "I think so."
A burndown chart replaces the guessing with a picture. It plots remaining work over time, so you can see at a glance whether your team is ahead, behind, or right on pace. No counting cards, no spreadsheets, no gut feelings.
More importantly, it gives you time to react. If you're falling behind on day 3 of a 10-day sprint, you have a week to adjust. If you don't notice until day 9, your only option is to miss the deadline and explain what happened.
What a burndown chart shows
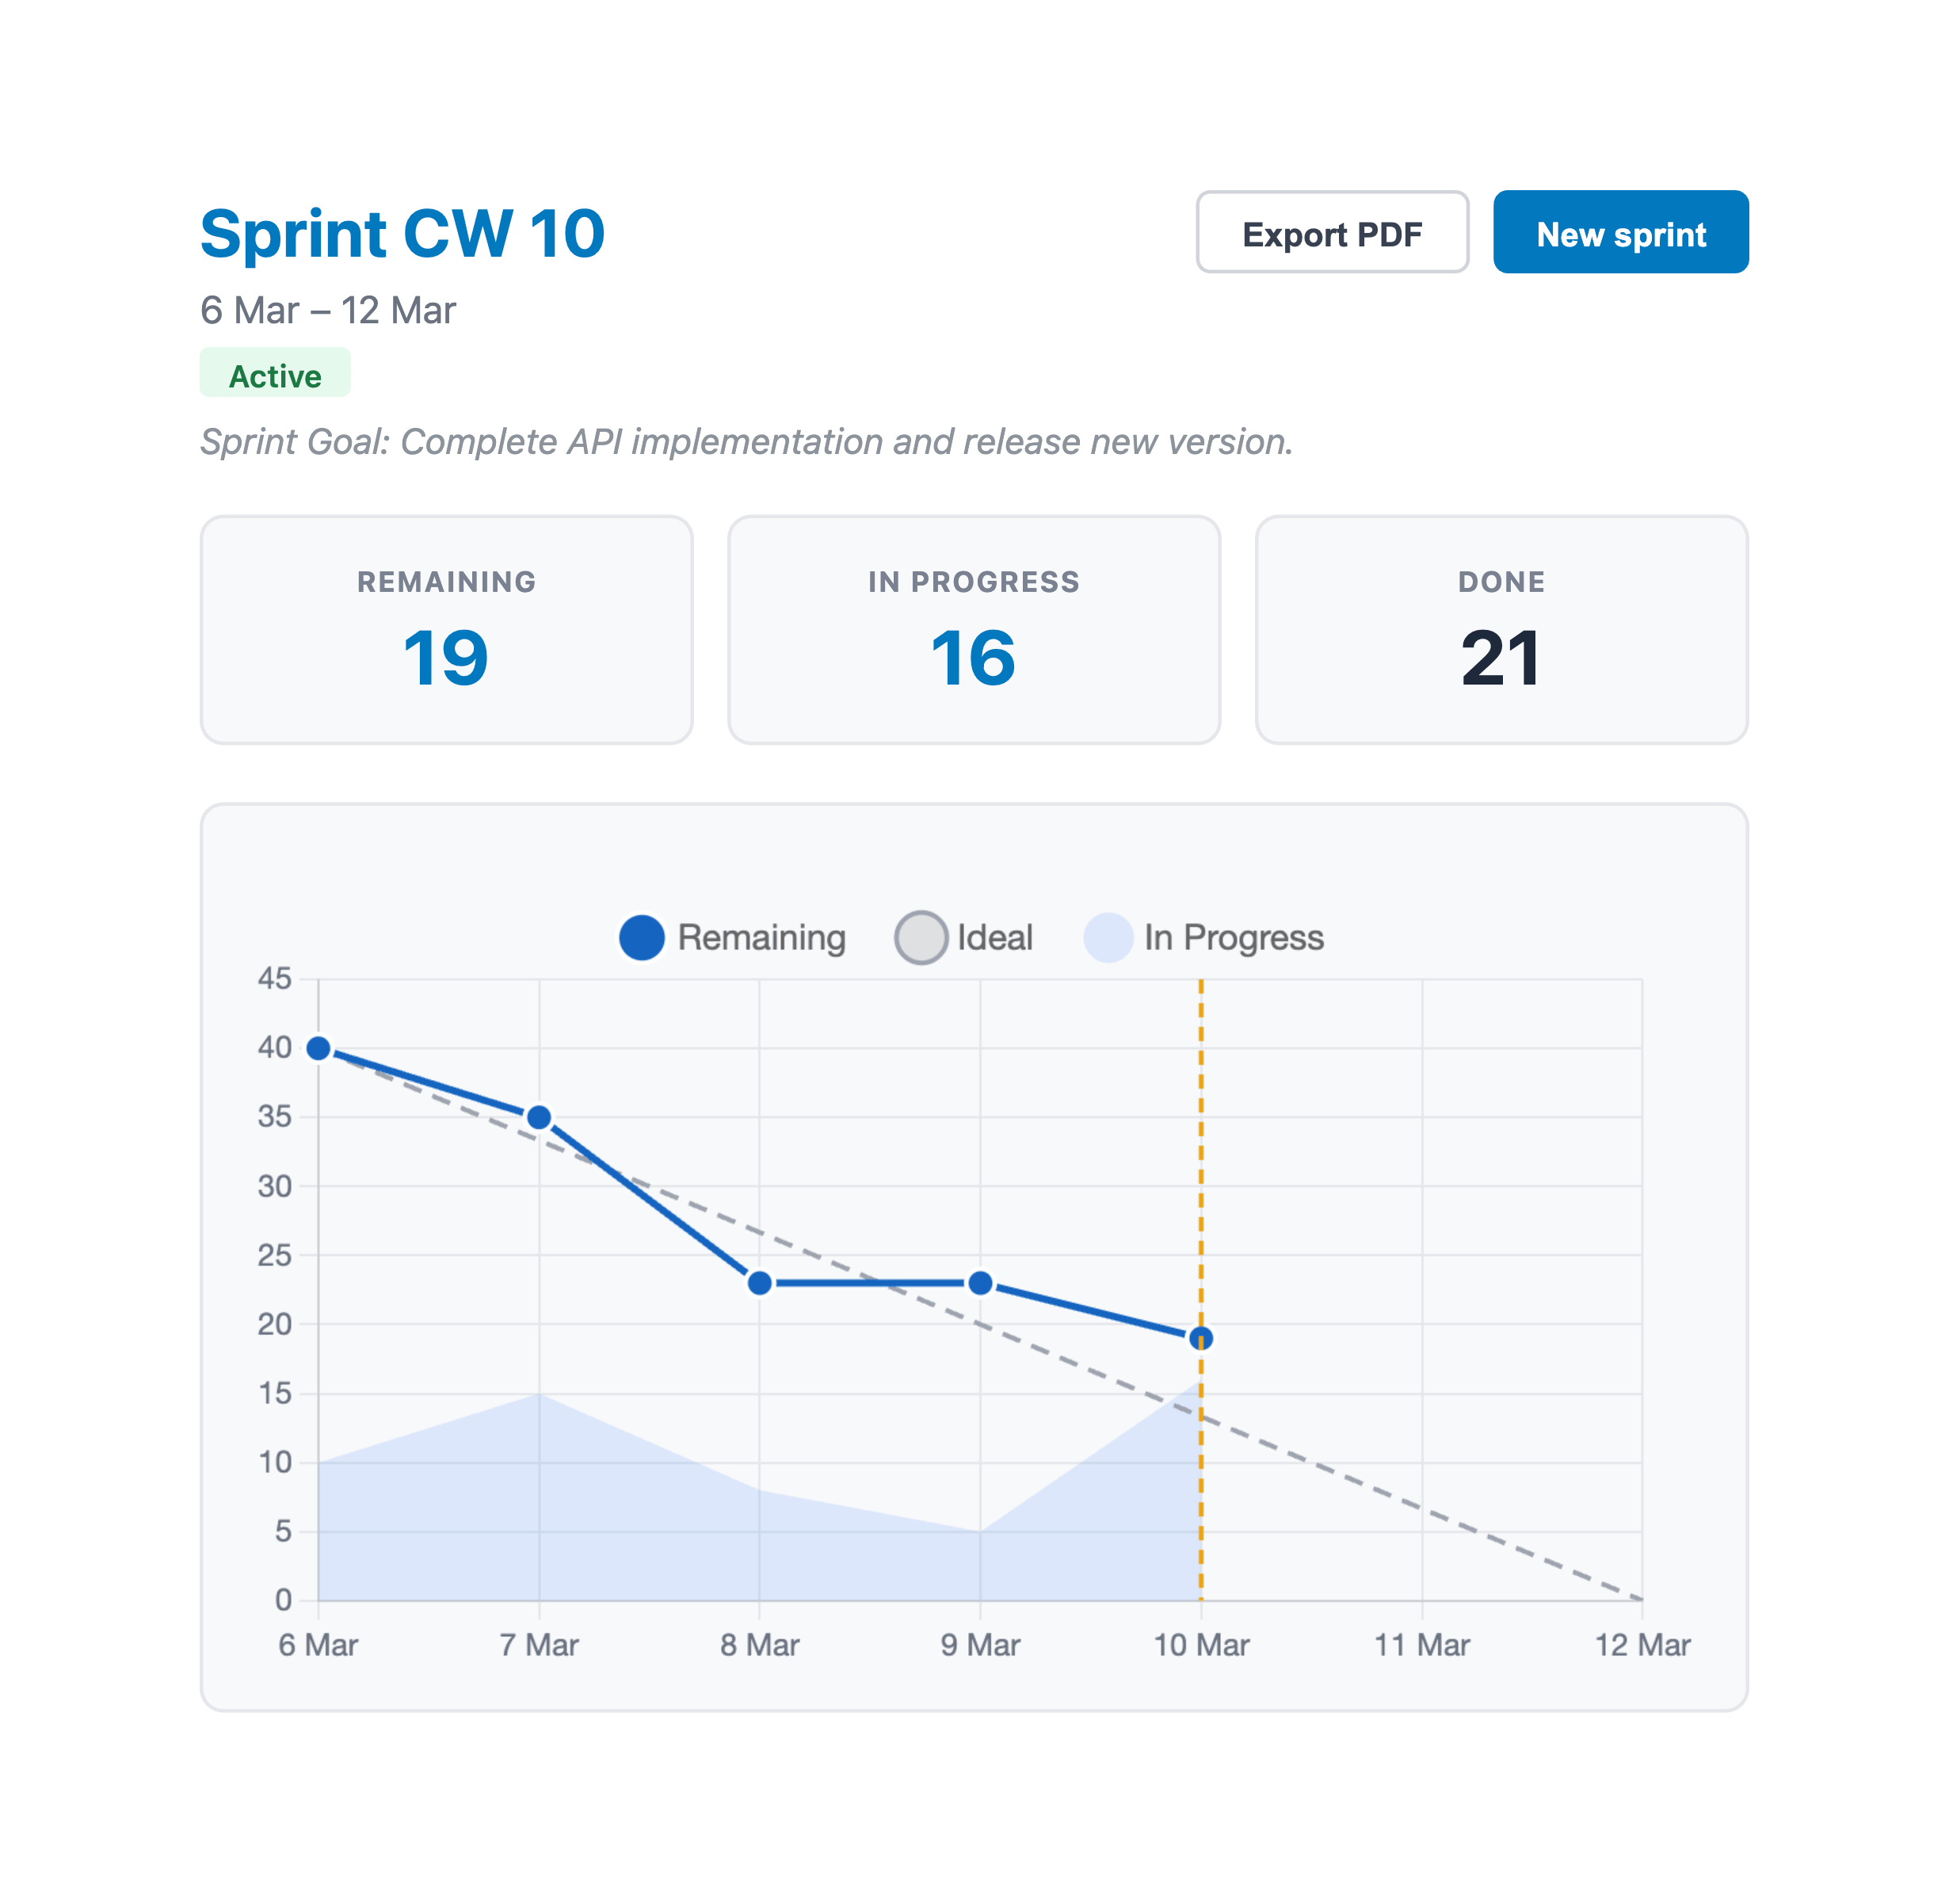
A burndown chart has two axes. The horizontal axis is time - the days in your sprint. The vertical axis is work remaining, measured in story points.
On top of that, you'll typically see two or three things:
- The ideal line - a straight diagonal from your total story points (day 1) down to zero (last day). This is what "perfectly even progress" looks like. It's a reference, not a target.
- The actual remaining line - your real remaining work, updated daily. This is the line that matters.
- In-progress area - some charts (including EstiMate) shade the gap between "remaining" and "remaining + in progress" to show how much work is actively being worked on but not yet done.
The relationship between the ideal line and the actual line tells you almost everything you need to know about how the sprint is going.
How to read the chart
Forget about the first day or two. The chart is noisy at the start because the team is still picking up cards and getting into the flow of the sprint. The real signal shows up from day 3 onward.
Actual line below the ideal line
You're ahead of pace. The team is completing work faster than the straight-line average. This is a good position, but don't celebrate too early - it could also mean the easy cards got done first and the hard ones are still ahead.
Actual line above the ideal line
You're behind pace. The gap between the two lines is how many points behind you are. A small gap early on is normal. A growing gap after the midpoint is a problem.
Flat sections
The actual line going flat for 2-3 days means nothing is being completed. This doesn't necessarily mean people aren't working - they might be working on large cards that haven't moved to Done yet. Check the in-progress area: if it's wide, work is happening but not finishing. If both are flat, something is blocked.
Sudden drops
A big vertical drop means several cards were completed at once. This is common mid-sprint when a batch of related work lands. It can also happen when someone finally moves three cards to Done that were "basically done" for two days. Both are fine - it's the overall trend that matters, not individual days.
The line goes up
If remaining work increases during a sprint, scope was added. New cards were brought into the sprint, or existing cards were re-estimated higher. This isn't always bad - sometimes you discover that a 3-point card is really an 8 - but frequent scope increases are a sign that planning needs work.
Common burndown patterns
After a few sprints, you'll start recognizing shapes. Here are the ones you'll see most often:
The hockey stick. Flat for most of the sprint, then a steep drop at the end. This means the team finishes everything in the last 2-3 days. It usually works out, but it creates stress and makes it impossible to course-correct. If you see this pattern repeatedly, cards might be too large. Try breaking them into smaller pieces that can be completed more frequently.
The staircase. Periods of flat, followed by drops, then flat again. This is actually normal for most teams. Work doesn't get completed in a perfectly smooth line - it happens in bursts. As long as the staircase roughly follows the ideal line, you're fine.
The slow start. The line stays flat or barely moves for the first third of the sprint, then catches up. This often happens when the sprint starts with investigation, design, or setup work that doesn't directly produce "done" cards. Not a problem if it's expected, but watch for it becoming a habit.
The runaway. The actual line drifts further and further above the ideal line with no sign of converging. This sprint is in trouble. If you see this by the midpoint, it's time to cut scope - pull cards out of the sprint, not add them.
What to do when you're behind
The whole point of tracking burndown is to know early enough to do something about it. Here's a practical playbook:
Check the in-progress area first. If there's a lot of work in progress but not much getting done, the issue is usually work-in-progress limits. Too many cards open at once means context switching and nothing actually finishing. The fix: stop starting, start finishing. Have people complete their current cards before picking up new ones.
Look for blockers. Are cards stuck waiting for a review, a decision, or an external dependency? Sometimes one blocked card holds up three others. Unblocking it might be the highest-leverage thing you can do.
Cut scope deliberately. If you're genuinely behind with no path to catching up, remove the lowest-priority cards from the sprint. Send them back to the backlog. It's better to deliver 30 points cleanly than to half-finish 40. This isn't failure - it's how sprints are supposed to work.
Don't extend the sprint. It's tempting, but it defeats the purpose. Sprints are fixed time boxes. If you can't finish, you learn from it and plan better next time. Stretching a 2-week sprint to 2.5 weeks just hides the problem.
Setting up a burndown chart in Trello
Trello doesn't have a built-in burndown chart. You need a Power-Up that reads your card data and plots it over time.
With EstiMate, you get a burndown chart that updates automatically based on your Trello board. Here's what the setup looks like:
- Add story point estimates to your cards
- Create a sprint - name it, set start and end dates, and map your lists (which list is To Do, In Progress, Done)
- That's it. EstiMate takes a daily snapshot of remaining and in-progress points and plots the chart
No manual data entry, no spreadsheets, no exporting CSV files. The chart reads directly from your board state.
EstiMate also shows a "today" marker on the chart - an amber vertical line that makes it easy to see exactly where you are in the sprint timeline relative to the ideal line.
What burndown charts don't tell you
Burndown charts are great for one thing: are we completing work at the pace we planned? But they don't tell you everything.
They don't measure quality. You can burn down 40 points in a sprint and ship buggy code. The chart looks great. The customers are unhappy. Always pair burndown tracking with whatever quality checks your team uses - code reviews, QA, demos.
They don't show what changed. If scope was added and removed in equal amounts, the chart looks the same as if nothing changed. But the team experienced churn. If you suspect scope instability, track the number of cards added or removed mid-sprint separately.
They don't explain why. A flat line tells you nothing is getting done but not why. Was the team pulled into meetings? Was there a production incident? Did a key person go on vacation? The chart raises the question - you have to investigate the answer.
Making the most of your burndown
A burndown chart sitting in a dashboard that nobody looks at is useless. Here's how to actually get value from it:
- Check it at standup. Glance at it during the daily standup. It takes 10 seconds and gives everyone the same picture of where the sprint stands. No need to discuss it every day - just look at the trend.
- Use the midpoint as a checkpoint. Halfway through the sprint, take a deliberate look. If you've burned less than 40% of the points, you probably need to make a scope decision.
- Review it in the retro. After the sprint, look at the shape of the burndown together. It often tells a story: "We were blocked for three days waiting on the API team" or "We committed too much and had to cut scope on day 7." These are valuable patterns to spot.
- Compare across sprints. Does your team always start slow? Always finish in a rush? Seeing the same shape over multiple sprints tells you something about your process that a single sprint can't.
Getting started
If you're already running sprints but not tracking burndown, you're missing the most useful feedback loop in scrum. You don't need to change your process - just add visibility.
Add EstiMate to your Trello board to get burndown charts, sprint tracking, and velocity - all built on top of the Trello workflow you already have.
Keep reading
- How to Forecast When Your Project Will Be Done in Trello - the same burndown line, stretched across the whole project
- How to Estimate Story Points in Trello - the estimation step that feeds your burndown
- Trello Sprint Planning Guide - set up sprints, velocity tracking, and more
- Planning Poker in Trello - get better estimates with team voting sessions
- How to Set Up Trello for Scrum - board structure, ceremonies, and common pitfalls
- How to Track Team Velocity in Trello - measure and use your team's sprint velocity
- Capacity Planning for Trello Teams - plan sprint capacity based on team availability
- What 1,000 Trello Teams Taught Me About Estimation - patterns I keep noticing across teams
Track your sprint progress with burndown charts
EstiMate adds burndown charts, sprint planning, and velocity tracking to your Trello board. Free to get started.
Add EstiMate to Trello